 3 Comments
Amazon Q4 is upon us, with just 11o shopping days until Christmas!
And as sellers, heading into the final months of the year, we need to make sure we’re fully prepared. Managing inventory flow. Creating promotional deals. Extra sales efforts for the holiday season.
But how can we know what to expect in the upcoming 4th quarter? Well, we have it covered, and we’re going to share that info with you.
First though, before we suggest a few tips on what lies ahead and how to prepare, we have some pretty cool data to go over with you.
How we know what we know.
In order to help sellers predict future Q4 sales, we looked back at historical Amazon sales trends from Jungle Scout’s AccuSales algorithm, the most accurate marketplace tool for understanding Amazon sales data.
To start, our highly skilled data science (DS) team dug into the major sales spikes they saw around Amazon Prime Day and Q4 in 2018.
Next, they compared those sharp increases to sales spikes (including Prime Day) in 2019 thus far. By digging into those millions of data points, the DS team was able to get a picture of Amazon’s average sales performance.
The DS team used AccuSales data for directional visualization (ie. we’re showing data from a certain set of sellers that’s not reflective of ALL Amazon sales), and pulled the actual sales numbers published by Amazon to paint a more complete picture (see below).
So what did we learn from this analysis of 2018 to help us prepare for 2019? Let’s take a look.
Takeaways from Prime Day 2018.
The DS team looked at AccuSales data during the five weeks leading up to both Prime Day and Cyber Monday, as well as the five weeks following. We compared similar timeframes to capture the sales rebound after Christmas.
Using the average daily sales for 2018 Q3 as the baseline, the calculated ratio is depicted by the red line on the graphs above.
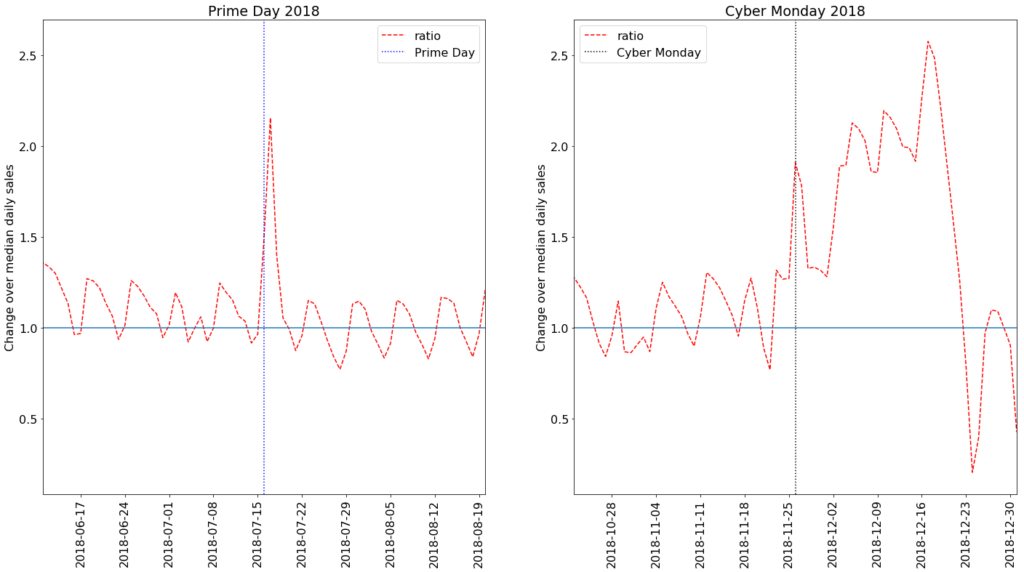
In the data set surrounding Prime Day, sales increased by 110% on Amazon’s biggest day of the year. This is relative to the average sales that quarter.
Also, it’s important to note that, with Amazon’s website issues last year, the sales spiked the day after Prime Day when the problems were solved.
As for the subsequent drop in sales post-Prime Day, that has become the Amazon norm. It’s expected by seasoned sellers.
And that’s where we’re sitting today (and for the next few months), leading into the holiday rush.
ATTENTION (late) SHOPPERS!
December 21st is, unofficially, the busiest shopping day of the year.
Look at that sales spike!
In 2018, the holiday rush started to build on Cyber Monday. Sales went up 80%, compared to the average daily sales for 2018 Q4 (our baseline).
However, despite that jump and the notorious online shopping frenzy that follows Black Friday, holiday sales didn’t quite reach Prime Day’s performance.
Amazon confirmed that in a July, 2019, press release, saying Prime Day sales totaled more than their 2018 Black Friday and Cyber Monday revenue combined.
The contributing factors:
- The duration of Prime “Day” continues to increase. This year, Prime Day was the longest yet and lasted 48 hours. In 2018, Prime Day lasted 36 hours. In 2017, it lasted 30. Obviously, the longer a sale runs, the higher the revenue.
- Prime Day drives a huge number of member sign-ups, and its sales spike reflects all of those new Prime subscribers. Cyber Monday doesn’t have that same incentive for people to become Prime Members.
- Unlike Prime Day, there are a lot of competing companies offering online shopping deals. Cyber Monday isn’t exclusive to Amazon. And the wider the offering, the wider the spread of sales across multiple sales platforms.
However, regardless of those differences, Prime Day is still an excellent resource to help predict Q4 sales performance.
Based on the ratios above, we estimate that Cyber Monday sales were roughly 15% lower than Prime Day’s. But, by the end of the first week of December 2018, sales were doubling on average.
They also averaged an increase of over 150% just days before Christmas.
Additionally, it’s important to note that after sales took a nosedive on Christmas, they rebounded pretty quickly.
The good news is, we can all use this insight to plan ahead for the holidays’ mega-shopping days by simply referring back to our own Prime Day stats.
All we need to do is pull our Business Reports from Seller Central for the Prime Day time period, taking our product’s performance in both 2018 and 2019 into account.
If we can maintain an inventory level in the Amazon warehouse that meets our Prime Day sales threshold, our stock should cover sales for the busiest time of the year.
2019 Prime Day insights.
Now that we’ve assessed 2018 and established some key takeaways, let’s compare that to what we know about 2019 sales until now.
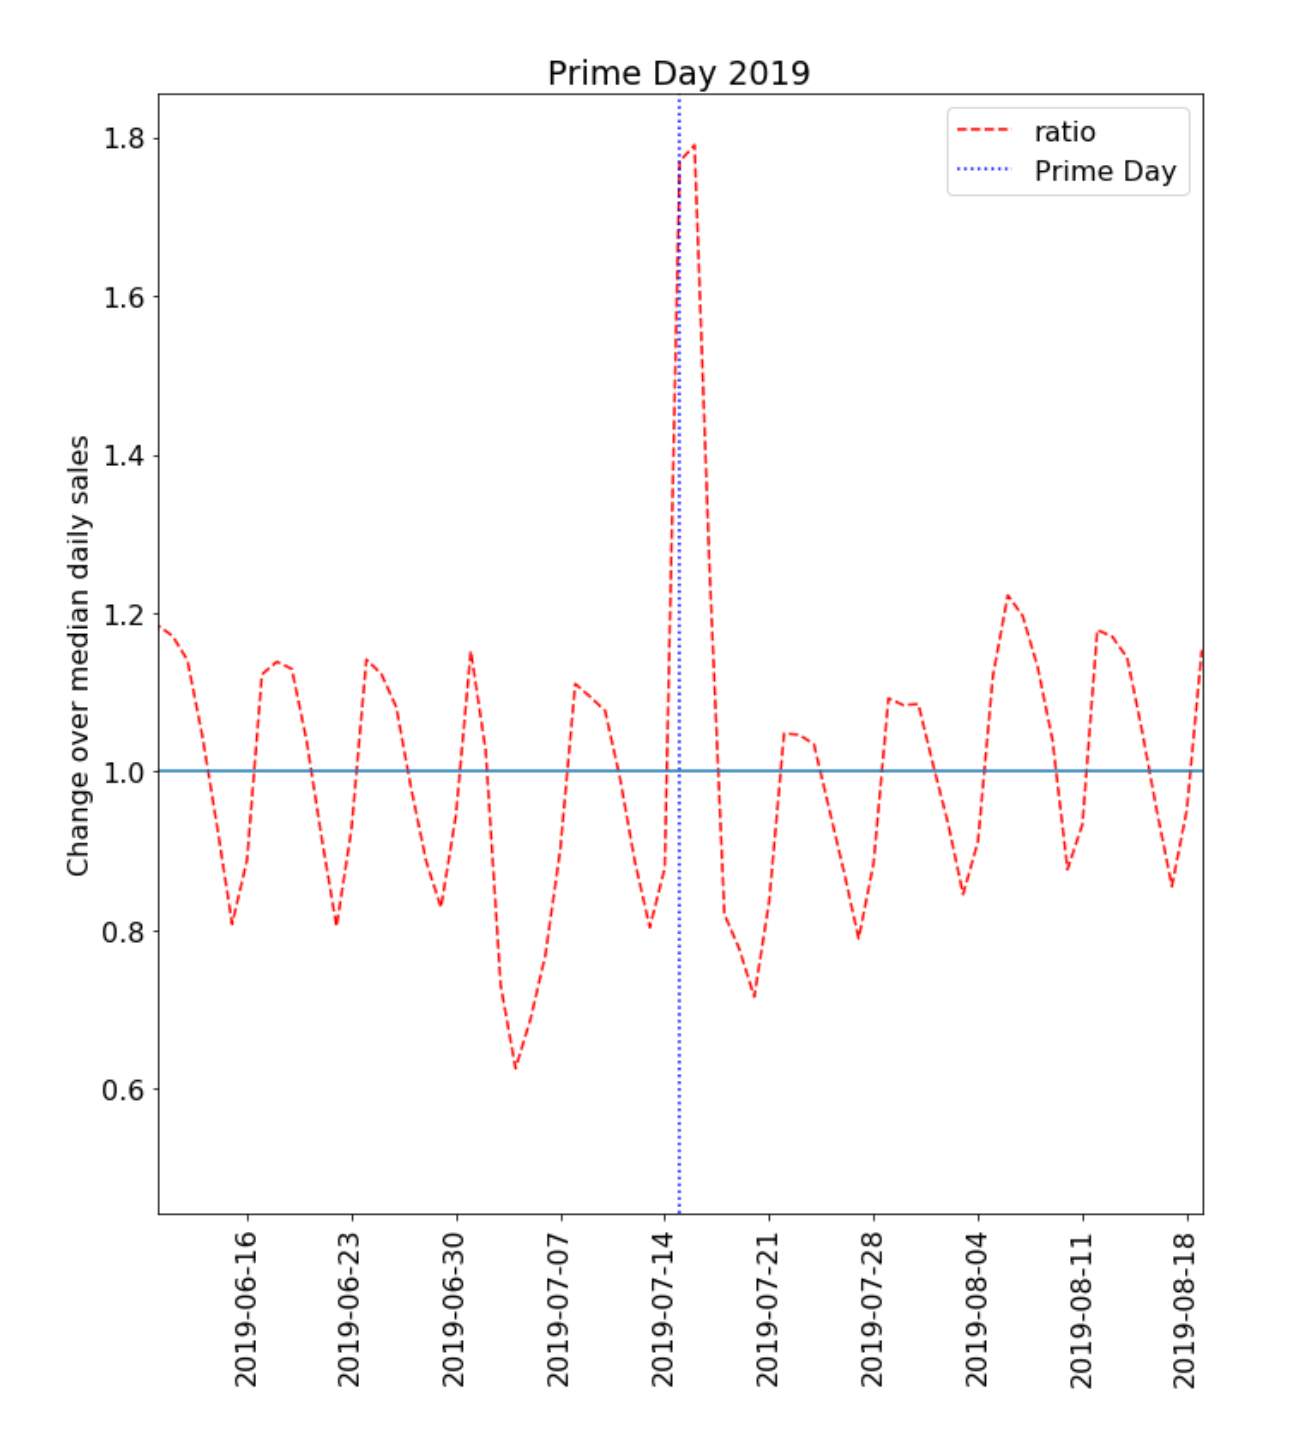
Again, we’re using the average daily sales for 2019 Q3 as the baseline, and the calculated ratio is depicted by the red line.
On average, Prime Day 2019’s sales didn’t quite hit as high of a spike as Prime Day 2018. Instead, Prime Day 2019 sales were 80% higher than normal, matching the sales spike on Cyber Monday 2018.
But it’s not that far off the mark.
And if 2018’s Q4 is any indication, our data establishes a similar sales trajectory year over year. Therefore, we can safely predict that average sales will begin to rise starting on Cyber Monday, with the sales boost lasting until the end of Q4.
What we know about Amazon Q4.
Now that we’ve examined our data from 2018 and 2019 (to date), we can begin to match that data against what we know about Q4:
- In 2018, Amazon’s net sales increased 20% to $72.4 billion in the fourth quarter, compared with $60.5 billion in Q4 2017.
- More than 50% of all Amazon sales from the 2018 holiday season were generated by small and medium-sized businesses.
- Sales typically increase 4x for sellers in November, and 5x for sellers in December.
With these three solid stats alone, we know just how much the holiday rush can make or break our business. And the best part is that we all have the potential to capitalize on this massive increase in sales.
How can you benefit from this intel?
We recently hosted an Ultimate Amazon Q4 Seller Session to go over a few strategies, including:
-
- Preparing your inventory (if you haven’t already)!
- Powering up your listing.
- Monitoring your performance – sales, inventory levels, and advertising spend.
- Communicating with your customers.
We strongly recommend taking the time to refresh your Amazon Q4 knowledge. Lenny and this webinar will help you to level-up.
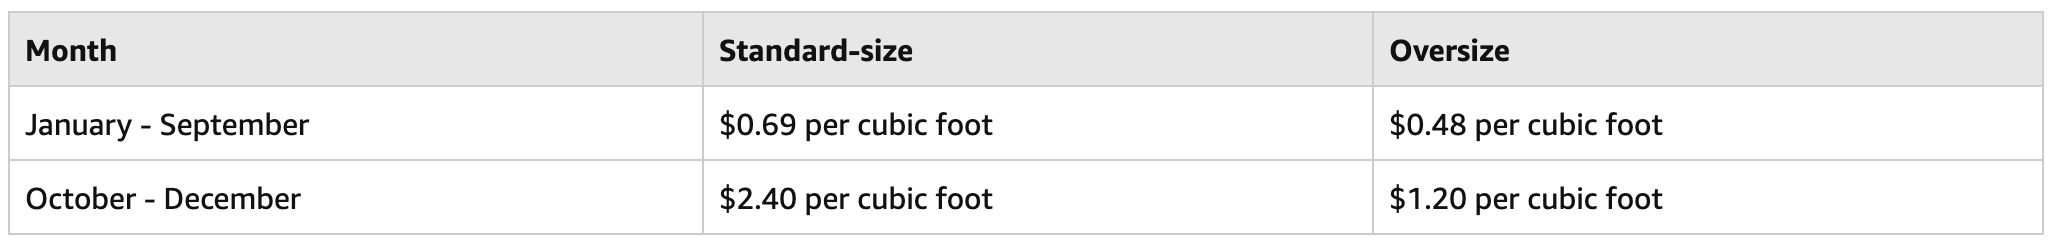
Furthermore, we advise double-checking the seasonal storage fee increases below. You may want to consider/plan any Lightning Deals in advance as well, as doing both will help prepare you financially for the busy road ahead.
Learn more about Amazon Lightning Deals!
Seller Advice for Amazon Q4:
-
-
- You must be ready, both physically (product-wise) and financially, for your sales to increase anywhere from 30-200%. You need to be prepared for increases in shipping and storage rates too.
- Take the time to recreate your customer’s experience by checking your listing from a shopper’s perspective, on both a desktop computer and a mobile device. Make sure everything is current and optimized; especially for mobile, as more and more sales are happening on devices!
- Try creating seasonal bundles and begin offering them a few weeks before the holiday shopping season begins. That will give them time to gain traction.
- Bring the holiday spirit to your listing. Mention gift wrapping options, or temporarily include holiday-themed product photography.
- You will only benefit from the massive holiday shopping rush if you have a compelling offer. Coupon(s), Lightning Deal(s), and/or added freebies are crucial to your Q4 success.
- You always need more inventory than you think you need! Even if you think you’ve ordered enough, you’re more likely to be understocked than overstocked. Applying the above-data to your own sales should assist in minimizing the chances of that happening.
-
Now you’re ready to tackle the holiday rush!
Take our data insights with a grain of salt.
While we’ve charted and analyzed Amazon’s average daily sales to make our Q4 predictions, tracking your own product sales overtime will always provide the most accurate insights for your personal business.
What we’re sure of though, is that Amazon sellers can see anywhere from 30 to 50% more sales in Q4 alone!
And as long as we keep data in the driver’s seat for all of our Amazon-related decisions, we can better manage our expectations for the remainder of 2019.
Do you have any tips and tricks up your sleeve for the fourth quarter? Add them below! We’d love to hear them.
3 comments on “Amazon Q4: Predictions & Preparation”
I congratulate, a magnificent idea
I’m a little confused here. Can you please elaborate how these two work together?
“Sales typically increase 4x for sellers in November, and 5x for sellers in December.”
and
“What we’re sure of though, is that Amazon sellers can see anywhere from 30 to 50% more sales in Q4 alone!”
If you’re “typically” seeing 4x-5x sales for 2/3 of Q4 how does that turn into a high side of 50% more sales? I imagine it would be closer to 300% plus. Thanks in advance.
Heh! Good question.
Personally, I see 4x more sales between November and December (starting around black Friday and ending about 4 days before X-Mas), especially if I do lightning deals.
the data we’ve collected shows, on average, all product categories see about a 50% increase. Some categories don’t do as well as others: for example, industrial doesn’t see a holiday spike, whereas Kitchen/dining sees a huge spike.
So I believe what she meant was that most sellers–who tend to operate in popular categories like K/D–see spikes.
I can say personally, as a 4 year seller, that yeah, 300% is about what I get during Q4. 🙂